| Grilles de pluies mensuelles IRD-HSM |
|
A des fins d'utilisation en modélisation, nous avons rassemblé toutes les données pluviométriques disponibles auprès de l'ORSTOM (aujourd'hui IRD), le CRU (" Climate Research Unit " de l'Université " East Anglia ") et d'autres sources et les avons mises sous une forme qui nous permet d'établir, sur l'Afrique de l'Ouest et Centrale, des grilles pluviométriques mensuelles dont l'unité d'espace est une maille de surface 0.5° * 0.5°, soit approximativement 2750 km². Fenêtre et période de validation des grilles pluviométriques En fonction de différents éléments, il nous a semblé judicieux de construire des grilles dans une fenêtre " espace " limitée à la partie terrestre comprise entre les latitudes 2°S et 18°N et les longitudes 18°W et 17°E et dans une fenêtre " temps " qui débute à la décennie 1940 et s'arrête à la décennie 1990 incluse. Toutefois, pour ne pas avoir des effets de bord lors de l'interpolation spatiale, nous avons utilisé des postes pluviométriques qui dépassent ces limites et qui couvrent 21 pays. Les données et les stations pluviométriques retenues pour la construction des grilles Les données proviennent principalement de 2 sources : l'IRD et le CRU
- IRD : les données existantes, à un pas de temps journalier ou mensuel, constituent un peu plus de 89% des données utilisées.
Les stations retenues sont :
- Des stations primaires (synoptiques) : ce sont les stations de base dont l'observation est permanente et sur lesquelles l'étude statistique permet de définir les caractéristiques climatiques d'une région donnée.
En 1977 puis en 1984, le Comité Interafricain d'Etudes Hydrauliques, avec l'aide financière du Ministère de la Coopération de la République Française, a confié à l'ORSTOM et l'ASECNA, pour tous les états membres du Comité, la publication de tous les relevés de précipitations journalières effectués de l'origine des stations à 1980 aux stations synoptiques du réseau météorologique national, aux postes climatologiques et aux postes pluviométriques, agréés par les services météorologiques nationaux. L'ORSTOM a effectué les travaux de comparaison saisie - originaux, de critique " initiale " des données et de préparation informatique de la publication. La critique " initiale " se basait sur une critique " à vue " et automatique. La critique " à vue " s'appuyait sur des comparaisons inter-postes et sur la connaissance de la personne chargée ce travail et était, donc, " subjective ". La critique automatique s'appuyait sur des tests mis en évidence lors de la critique " à vue " et était donc " objective ". Elle s'appuyait sur le nombre de jours de pluie par an (> 0.1 mm), sur le rapport du nombre de jours de petites pluies (< 10 mm) au nombre de jours de pluie dans l'année et sur la recherche d'apparition de valeurs multiples en nombre exagéré (erreurs d'éprouvette). Au-delà de 1980, un tel travail n'a pas été poursuivi ; toutefois, ponctuellement, pour des travaux de recherche, des vérifications et des corrections ont pu être apportées. Mais elles ne sont certainement pas du même niveau de rigueur que celles faites auparavant.
|
 |
|
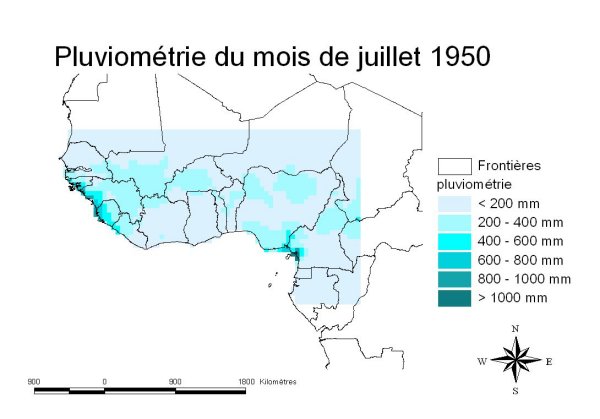
Exemple de la grille construite pour le mois de Juillet 1950
|
|
La procédure d'interpolation Nous avons fait le choix d'utiliser le maximum d'information disponible pour la construction de chaque grille mensuelle. Donc les points d'interpolation ne sont pas toujours les mêmes d'un mois à l'autre et d'une année à l'autre. Ce choix peut paraître discutable mais il nous semble dicté par les meilleures raisons. A partir de ces grilles, nous ne souhaitons pas caractériser la variabilité climatique en Afrique de l'Ouest et Centrale comme les grilles du CRU qui ont été construites avec ce souci premier. L'objectif premier de construction des grilles IRD est de fournir pour les modèles hydrologiques que nous utilisons une entrée pluie qui soit la plus proche de la réalité possible. On fait l'hypothèse que les sorties de nos modèles sont globalement meilleures lorsque la plus grande quantité d'information sur la pluie est utilisée. La méthode d'interpolation choisie est un krigeage simple, méthode géostatistique qui a prouvé sa robustesse dans beaucoup d'applications environnementales. Le variogramme choisi est un variogramme linéaire simple. Cette méthode s'applique particulièrement bien à la construction de grilles à partir de points irrégulièrement positionnés dans l'espace, problème récurrent dans le domaine de la construction de grilles de données climatologiques. Format des grilles : Chaque enregistrement : "latitude (degrés décimaux) longitude (degrés décimaux) janvier (mm), février (mm),…, décembre (mm)" |

|
 Fermer cette page
 Imprimer cette page